
Companies included:
ADU Adamus Resources Ltd
CAH Catalpa Resources Ltd
CQT Conquest Mining Ltd
DRA Dragon Mining Ltd
FML Focus Minerals Ltd
IGR Integra Mining Ltd
KCN Kingsgate Consolidated Ltd
MML Medusa Mining Ltd
NGF Norton Gold Fields Ltd
NMG Noble Mineral Resources Ltd
NST Northern Star Resources Ltd
PRU Perseus Mining Ltd
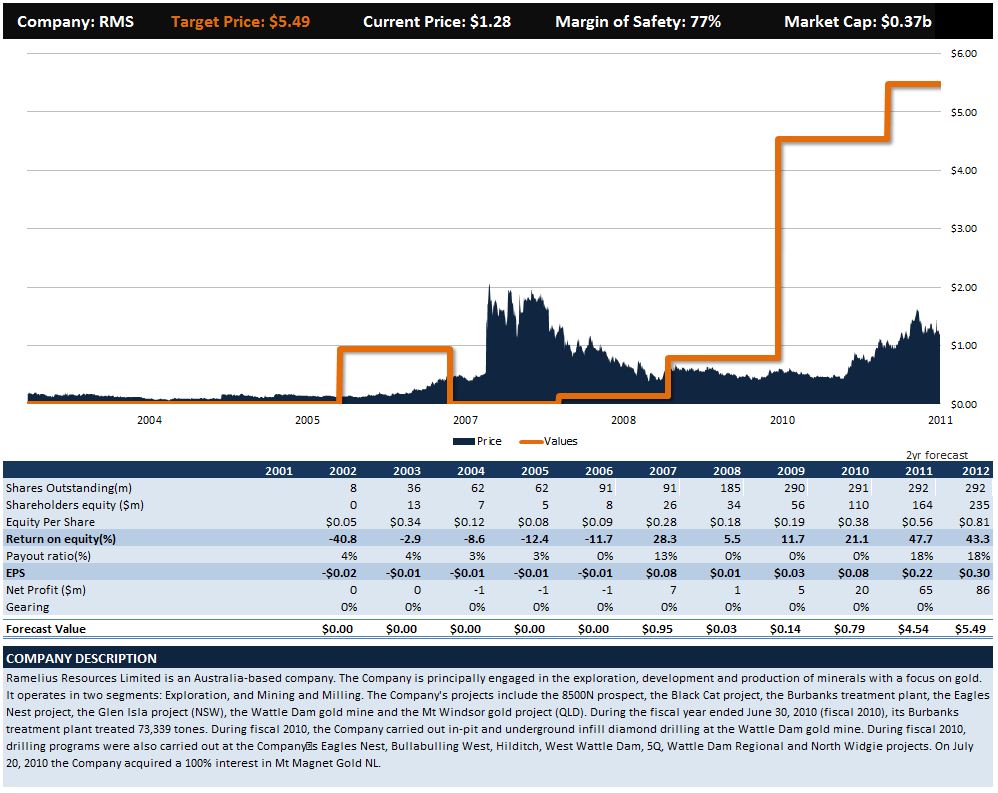
RMS Ramelius Resources Ltd
RRL Regis Resources Ltd
RSG Resolute Mining Ltd
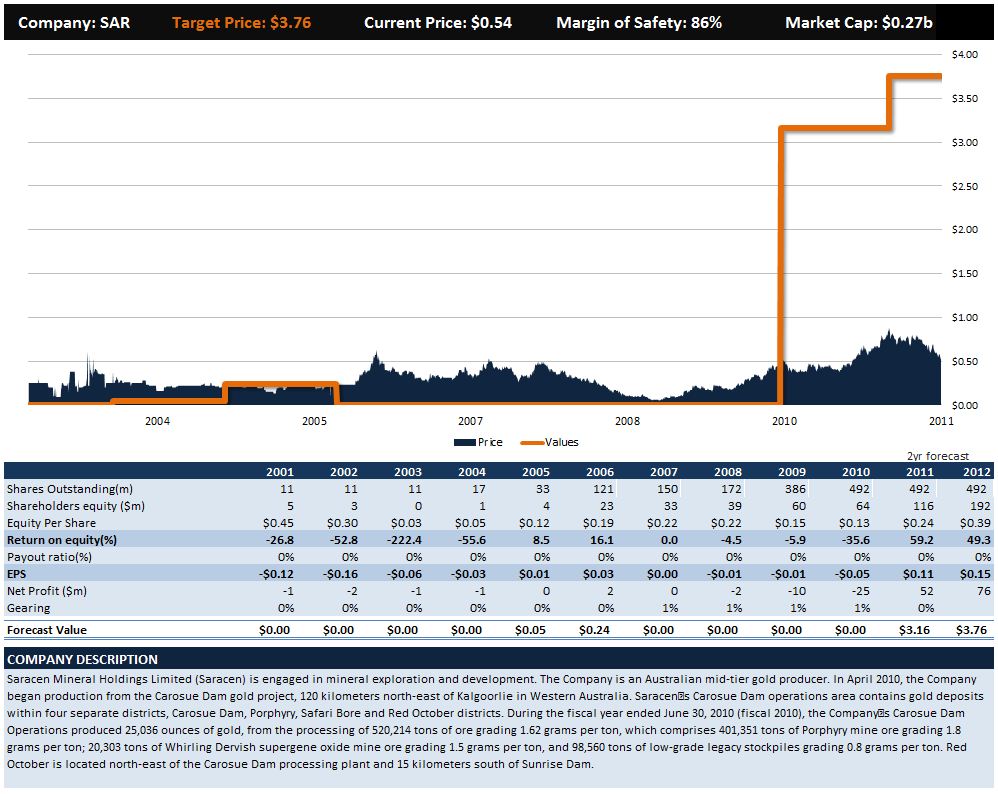
SAR Saracen Mineral Holdings Ltd
SBM St Barbara Ltd
SLR Silver Lake Resources Ltd
TAM Tanami Gold NL
TRY Troy Resources N L
*updated 30.06.11 - fixed shareholders equity figures for prior years*


Production forecasts are based on general information and costs are based on up-to-date figures. This comparison does not take into account the potential to reduce costs. Even if it did, I would discount it as I do not factor in reduced costs until they happen.
Companies excluded are: AGQ (insufficient data), AZM (not current producer), GOR (not current producer), GRY (not current producer), NCM (diversified production), OGC (diversified production), PIR (not current producer) and AGQ (not current producer).
From the list above, I've then generated a 'short-list' which excludes:
- insufficient margin of safety in the price (not enough value)
- high levels of debt
- too much shareholder dilution
- insufficient known production growth
- not currently cash flow positive from production
- are located in Africa (geopolitical risk)
Short-List

Focus (includes planned merger)
Strong production growth potential, but high total cost per ounce. Any higher and this is off the short-list. Very high margin of safety in current price. Cash liquidity levels could be higher and it is expected to improve in the next 12 months.
Kingsgate
Strong production growth potential and low total cost per ounce. Higher than average geopolitical risk. Good margin of safety in current price. Cash liquidity levels are a concern. Highest level of shareholder dilution in the short-list.
Medusa
Strong production growth potential and exceptionally low total cost per ounce. Slightly higher geopolitical risk. Good margin of safety in current price. Very strong cash flows from operations. Almost no shareholder dilution.
Ramelius
Good production growth potential and low total cost per ounce. Very high margin of safety in current price. Very strong cash flows from operations.
Saracen
Good production growth potential, but high total cost per ounce. Very high margin of safety in current price. Good cash flows from operations. Higher levels of shareholder dilution.
St Barbara
Lower production growth potential, but high total cost per ounce. Good margin of safety in current price. Good cash flows from operations.
Silver Lake
Strong production growth potential, but high total cost per ounce. Very high margin of safety in current price. Good cash flows from operations. Lower levels of shareholder dilution.
My current positions:
Medusa
Ramelius
Focus
Potential additions:
Silverlake
Saracen


I'm not sure how you have came up with most of these companies as being "cash positve". You need to research a little harder in my opinion.
ReplyDeleteCash positive is referring to cash from operations... So thanks for the opinion.
ReplyDeleteThanks for making that clear. Operational cash positive is a bad way to model a business. Many companies go broke when they are "operationally cash positve".
ReplyDeleteOkay. This is not using operational cash as a way to model a business. That componennt is just a filter to exclude those that are not currently positive from operations.
ReplyDeleteThis model is based on earnings per share and return on equity whilst taking in to account business liquidity risk, share issuance and debt.
Yes but you're using operation costs only when working out earnings per share. How is Exploration, development and admin costs funded? ROE and EPS will be completely distorted and make a unprofitable business look good. FML operations are marginal at best and CRE operations are bleeding cash. Why were CRE happy to hand over their assets for next to no premium and after the share price has been destroyed? FML share price was even pumped 20% a week before the offer. Go figure!
ReplyDeleteSorry, it looks like you put a lot of effort in here but I don't agree with your analysis. You believe FML should be 50c with about 4.4 billion shares on offer? A 2.2billion dollar market cap? You are smarter than that! Please dont ramp these things onto unsuspecting newbies! World markets are heading down, gold looks vulnerable and FML is extremely high risk at this stage.
Just my opinion
Please don't jump to such hasty conclusions.
ReplyDeleteWhat makes you think that I'm only using operation costs when working out EPS?
Exploration, development and admin costs are projected forward based on recent known amounts. Of course they are included in the EPS forecasts.
Whilst FML operations don't have the margin that I prefer such as with MML or RMS, they still are operating with almost $500 margin per ounce before tax. I don't see this as marginal - although I wouldn't like it any tighter.
CRE are happy to sell out as they have not had sufficient cost control and they will go eventually broke if they don't. FML management know CRE assets so they will know what sort of margins they can achieve.
You don't have to agree with my price targets (they are my targets after all), but that doesn't make the analysis unsound. With potential net profit of close to $100m I don't think a 2.2billion market cap would be crazy - if it is clear that earnings are growing.
This isn't a ramp up. The analysis is consistent across the board. I'm happy to adjust the underlying assumptions where necessary.
Gold doesn't look vulnerable to me. In fact, it looks outstanding given the market turmoil.
Yes, FML is higher than average risk due to being a higher cost producer and that should be understood.
You've obviously put a lot of work into this, but your outputs do not make a lot of sense.
ReplyDeleteI'm not sure what valuation methodology you are using to derive your intrinsic value, but there are flaws with using a terminal value/ DCF analysis (which I suspect you have done), with most/ if not all of these companies. The only ones where it may be reasonable on the basis of consistency of free cashflow would be Medusa & RMS, but probably not RMS into the future due to uncertain production profile (and particularly likely decreased operating margin with Mount Magnet and reduced output from WD).
Why not use your macro filters to filter off a couple of the stocks and do a more in depth valuation- taking into account resources/reserves, actual growth profile (specific operations likely to increase output), exploration and capital expenditure to fund the growth.
I would be surprised if you reach the same valuations with a more in-depth approach.
Gold miners are very difficult to value at the best of times, and very very careful analysis of the cashflow statements reveal a lot more than the quarterly reports, where reported cash costs do not reflect the actual cost of mining an ounce of gold.
Great feedback.
ReplyDeleteI'll provide a detailed response for my underlying logic on this.
I've taken the opportunity to explain my process for valuing these companies in a new post. It does not change my conclusions as I'm very comfortable with the process used. Always happy to hear different views. Thanks.
ReplyDeleteSome of the stocks listed above look pretty high risk. But they may also be high reward.
ReplyDelete